

When people first enter the world of investing, they often focus only on stock prices. However, the price of a stock alone does not tell the real story behind a company. Smart investors rely on finance ratios to understand the true financial health of a business.
Financial ratios act as a diagnostic tool. Just as doctors analyze health reports to evaluate a patient’s condition, investors analyze financial ratios to evaluate a company’s performance, profitability, and stability.
On Financier Mind, the goal is to simplify financial concepts so that anyone interested in money, investing, and markets can understand them clearly. In this guide, we will explore the most important finance ratios every investor must know, along with real-world examples and practical explanations.
What Are Finance Ratios?
Financial ratios are ratios of different financial information items in the financial statements of a company.
They provide investors with information on whether the company is:
- Profitable
- Overvalued or Undervalued
- Financially stable
- Growing Efficiently
Financial ratios make it easy to read and understand complex financial information in numbers.
For example, instead of reading hundreds of pages of financial statements, an investor can use finance ratios to easily read and understand the financial position of a company.
Know more about finance ratios.
Why Finance Ratios Matter for Investors
Financial ratios assist investors in answering some crucial questions, such as:
- Is the company profitable?
- Is the stock overpriced?
- Is the company able to meet its debt obligations?
- Is the company using its capital in an efficient manner?
If financial ratios were not used, investors’ decisions would be based only on guesses.
Valuation Finance Ratios
These finance ratios help investors understand whether a stock is expensive or reasonably priced.
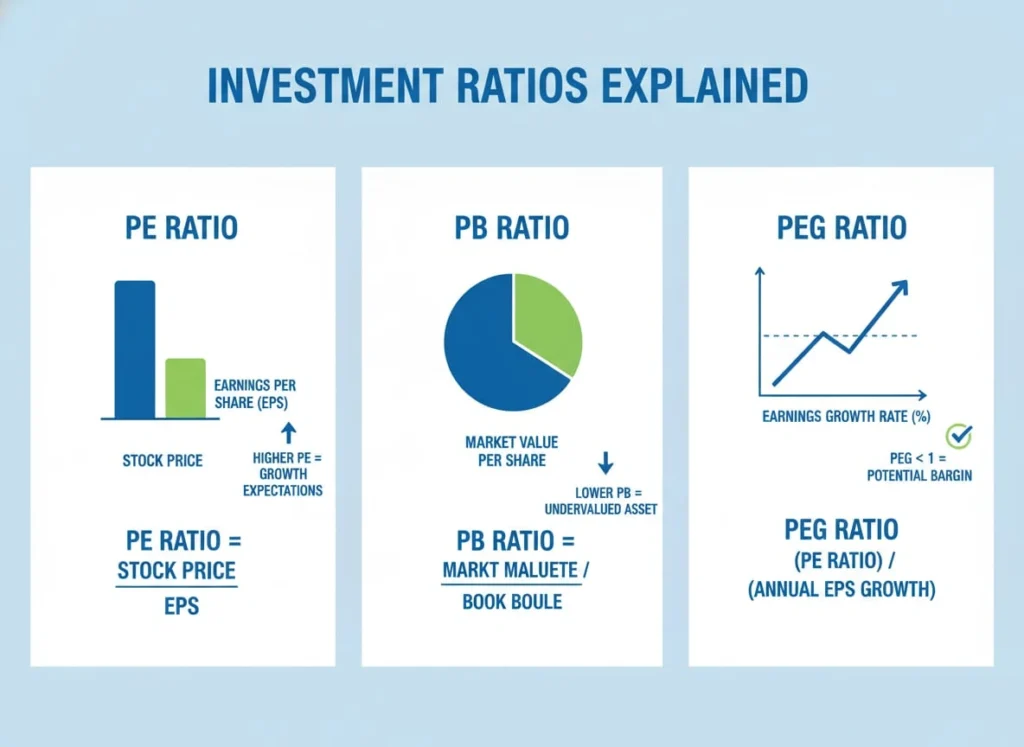
PE Ratio (Price to Earnings Ratio)
The Price to Earnings Ratio compares a company’s share price with its earnings per share.
Formula:
PE Ratio = Share Price / Earnings Per Share
Example
If a stock is trading at ₹100 and the earnings per share are ₹10:
PE Ratio = 10
This means investors are willing to pay ₹10 for every ₹1 of earnings.
Interpretation
- High PE → stock may be expensive.
- Low PE → stock may be undervalued.
However, PE must always be compared with industry averages.
PB Ratio (Price to Book Ratio)
The Price to Book Ratio compares a company’s market price with its book value.
Formula:
PB Ratio = Market Price / Book Value per Share
Example
If a company has a book value of ₹50 and trades at ₹100:
PB Ratio = 2
Investors are paying twice the company’s book value.
PEG Ratio (Price/Earnings to Growth)
PEG ratio adjusts the PE ratio based on expected growth.
Formula:
PEG = PE Ratio / Earnings Growth Rate
Interpretation
- PEG above 1 → potentially expensive
- PEG below 1 → potentially undervalued
Financial Stability Finance Ratios
These finance ratios evaluate a company’s ability to manage debt and short-term obligations.
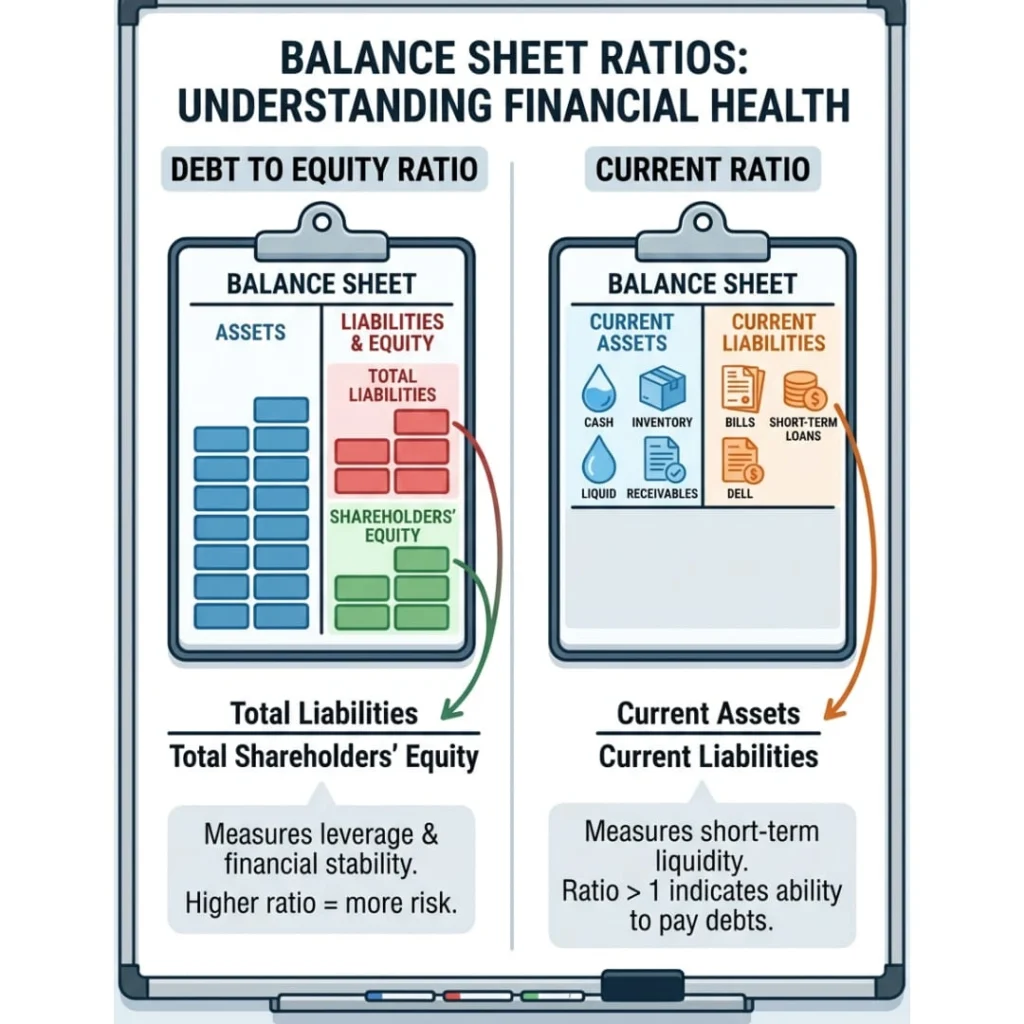
Debt to Equity Ratio (D/E)
The Debt to Equity Ratio measures how much debt a company uses compared to shareholder equity.
Formula:
Debt to Equity = Total Debt / Shareholder Equity
Example
If debt is ₹500 crore and equity is ₹1000 crore:
D/E Ratio = 0.5
Lower ratios generally indicate lower financial risk.
Current Ratio
The Current Ratio measures a company’s ability to pay short-term liabilities.
Formula:
Current Ratio = Current Assets / Current Liabilities
Interpretation
- Below 1 → potential liquidity issues
- Above 1 → healthy liquidity
Quick Ratio (Acid Test)
The quick ratio removes inventory from assets to measure immediate liquidity.
Formula:
Quick Ratio = (Current Assets − Inventory) / Current Liabilities
This ratio is considered a stricter measure of financial stability.
Profitability Finance Ratios
Profitability ratios measure how efficiently a company generates profit.

Debt to Equity Ratio (D/E)
The Debt to Equity Ratio measures how much debt a company uses compared to shareholder equity.
Formula:
Debt to Equity = Total Debt / Shareholder Equity
Example
If debt is ₹500 crore and equity is ₹1000 crore:
D/E Ratio = 0.5
Lower ratios generally indicate lower financial risk.
Current Ratio
The Current Ratio measures a company’s ability to pay short-term liabilities.
Formula:
Current Ratio = Current Assets / Current Liabilities
Interpretation
- Below 1 → potential liquidity issues
- Above 1 → healthy liquidity
Quick Ratio (Acid Test)
The quick ratio removes inventory from assets to measure immediate liquidity.
Formula:
Quick Ratio = (Current Assets − Inventory) / Current Liabilities
This ratio is considered a stricter measure of financial stability.
Market Performance Finance Ratios
These finance ratios help investors measure performance relative to the market.

Dividend Yield (DY)
Dividend Yield measures how much income investors receive from dividends.
Formula:
Dividend Yield = Annual Dividend / Share Price
Investors looking for passive income often prioritize this ratio.
Beta
Beta measures how volatile a stock is compared to the overall market.
- Beta = 1 → same volatility as the market
- Beta > 1 → more volatile
- Beta < 1 → less volatile
High-growth stocks often have higher beta values.
Alpha
Alpha measures how much a stock outperforms the market benchmark.
Positive alpha indicates strong investment performance.
Investment Market Terms Every Investor Should Know
Alongside finance ratios, investors frequently encounter key financial terms.

IPO (Initial Public Offering)
An IPO occurs when a private company offers shares to the public for the first time.
This allows companies to raise capital for expansion.
ETF (Exchange Traded Fund)
An ETF is a basket of securities that trades on stock exchanges.
Benefits include:
- diversification
- lower fees
- easy trading
REIT (Real Estate Investment Trust)
REITs allow investors to invest in real estate without directly buying property.
They typically generate income through rental properties.
Learn the crucial difference between SIP & FD so you can also start passive income through SIPs.
Asset Management Terms
AUM (Assets Under Management)
AUM represents the total value of assets managed by an investment firm.
Larger AUM often indicates higher investor trust.
NAV (Net Asset Value)
NAV represents the per-unit value of a mutual fund.
Formula:
NAV = Total Assets − Liabilities / Total Units
DCA (Dollar Cost Averaging)
Dollar Cost Averaging is an investment strategy where investors invest a fixed amount regularly.
Benefits include:
- averaging purchase price
- reducing timing risk
How Investors Use Finance Ratios Together
No single ratio provides a complete picture.
Professional investors combine multiple finance ratios to evaluate companies.
For example:
- PE Ratio for valuation
- ROCE for profitability
- Debt to Equity for financial risk
This multi-layer analysis improves decision making.
Final Verdict
Understanding finance ratios makes one mindset to investing from the perspective of speculation into informed decision making.
Finance ratios help investors evaluate companies objectively, reduce emotional bias, and build long-term wealth with greater confidence.
On Financier Mind, the goal is simple: make financial knowledge accessible so every reader can make smarter financial decisions.
FAQ’s
1. What are finance ratios?
Financial indicators used to evaluate a company’s performance are derived from financial statements.
2. Which finance ratio is most important?
PE Ratio for valuation.
ROCE for profitability.
Debt-to-Equity for risk management.
3. Can finance ratios guarantee profitable investments?
No, they help one in analysis but cannot predict markets perfectly.
4. Why should beginners learn finance ratios?
They simplify complex financial data.
Helps in avoiding poor investment decisions.
5. How many finance ratios should investors use?
Typically 5–10 key ratios for effective analysis.
1 thought on “The ultimate guide to Finance Ratios to better understanding Investors”